
How to Calculate Content Marketing ROI: A Quantitative Guide from Formula to Benchmarks
"Content marketing ROI is 4x higher than the most precisely targeted ad campaigns. The problem isn't that content doesn't work—it's that we're calculating it wrong."
"91% of B2B companies have adopted AI marketing tools, but 68% cannot prove ROI—attribution chain breakage is the core issue."
"Content marketing ROI median is 4.33:1, three-year cumulative ROI can reach 844%."
You spent 200k and closed 30k in-store—was it wasted?
A skincare brand ran Xiaohongshu for three months: monthly GMV about 200k, ROI just over 2.0—looks like a loss on paper.
Three months later brand search volume went from 8,000 to 32,000, new customers from 35% to 62%, and a June hit note still drove traffic in September. Blended ROI was about 6.8.
Content marketing often works; the math is what breaks. Visionary Marketing’s 2026 report says 91% of B2B teams use AI marketing tools, but 68% cannot state ROI clearly. Kraft’s data lead once noted content ROI can beat precision ads by about 4×—the issue is measurement, not channel fit.
This article is one job: make ROI legible—from formula and cost boundaries to a three-layer revenue model, benchmarks, cases, and how to explain results to leadership.
ROI Formula Explained—Four Calculation Logics from Basic to Advanced
ROI calculation seems simple: revenue minus cost, divided by cost. But behind the formula are three key definitions: what counts as revenue, what counts as cost, and what time period to measure. Get these three clear, and ROI can actually guide decisions.
Three Expression Formats
First, the most basic formula:
ROI = (Revenue - Cost) / Cost × 100%
This form is most common, suitable for short-term campaigns and single-channel scenarios. For example: invest 100,000 in advertising, generate 500,000 in sales. ROI = (500 - 100) / 100 × 100% = 400%. This means for every 1 unit invested, you get back 4 units in profit.
But in practice, many prefer the simplified version:
ROI = Revenue / Cost (multiplier form)
Using the same example, ROI = 500 / 10 = 5x. This expression works better for quick reporting—when the boss asks “how did this campaign perform,” saying “ROI 5x” is easier to understand than “ROI 400%.”
There’s a third version:
Revenue-to-Cost Ratio = Revenue : Cost
For example, 5:1 means for every 1 unit spent, you earn 5 units in revenue. This format makes it easy to compare with industry benchmarks. GenesysGrowth 2026 data shows the content marketing ROI median is 4.33:1—if you calculate 5:1, you know you’re performing well.
Four Logics in Practical Application
In practice, I’ve found four common calculation approaches differ by what’s in the denominator:
Logic 1: Revenue / Ad Spend
Simplest and roughest—only counts advertising costs. Good for quick estimates, but tends to inflate numbers since it doesn’t include labor and operations costs.
Logic 2: Revenue / (Ad Spend + Labor + Rent)
Includes team costs, making the number more realistic. But the issue is that fixed costs like rent and utilities may not have a direct relationship with content marketing.
Logic 3: Profit / Ad Spend
Uses profit instead of revenue as the numerator. This approach is closer to true “return on investment”—after all, revenue isn’t the same as money actually earned. According to HubSpot 2026 Marketing Statistics, this approach is common in e-commerce.
Logic 4: Profit / (Ad Spend + Labor + Rent)
Most rigorous, but often produces the ugliest numbers. Many bosses seeing ROI calculated this way would say “let’s not do this.”
Which is correct? Honestly, there’s no standard answer. The key is to tell the boss which calculation you’re using when reporting—don’t mix them. For example, comparing Logic 1 with the industry benchmark 4.33:1 isn’t appropriate—the benchmark includes full costs.
Benchmark Numbers Reference
SiegeMedia and Jasper’s materials have several key benchmarks:
- High-performing campaigns: 10:1 (every $1 invested generates $10 in revenue)
- Digital marketing benchmark: 5:1 as the high-performance standard
- Content marketing median: 4.33:1 (GenesysGrowth 2026)
For comparison: if you calculate ROI 3:1, looking at the 4.33:1 median, you know there’s room for improvement. If you calculate 8:1, that’s quite good—provided you’re using the same calculation as the benchmark.
Cost Definition—Complete Checklist of Direct + Hidden Costs
Many teams calculate ROI using only advertising costs, resulting in inflated numbers—appearing highly profitable, but potentially not even covering labor costs. A complete cost checklist should include four categories: direct costs, hidden costs, tool costs, and distribution costs. Missing any of these distorts ROI.
Direct Costs: Obvious Expenses
This part is easiest to calculate. Advertising spend, content production costs (outsourcing or material purchases), platform promotion fees—these are all visible on the books.
For example: an e-commerce brand advertising on Xiaohongshu, KOL collaboration fees of 80,000, platform promotion fees of 20,000, outsourced photography and production of 30,000. Total direct costs of 130,000—clear at a glance.
Hidden Costs: Labor Investment
This part is often overlooked, but usually represents the largest expense. How should content team labor costs be calculated?
I’ve seen this approach: a team of 5 with total monthly salaries of 50,000, producing 20 pieces of content monthly. Per-piece labor cost = 50,000 / 20 = 2,500. If those 20 pieces generate 100,000 in direct sales, the ROI accounting for labor is much lower than if you only counted advertising costs.
This also includes planning time, editing and revision, project management—these hidden investments are often underestimated. Honestly, bosses don’t see these time costs, but they’re real.
Tool Costs: Technology Investment
Marketing automation tools, CRM systems, data analytics tools—should these subscription fees be included in ROI?
My recommendation: allocate by usage percentage. If a tool is used for content marketing 80% of the time, include 80% of the cost. For example, HubSpot annual fee of 120,000, with 80,000 used for content marketing—then 80,000 becomes part of the cost.
Distribution Costs: Channel Expenses
Social media operations time, SEO optimization investment, partnership channel fees—these count too.
There’s an interesting data point: Sirius Decisions reports that 60%-70% of content goes unused. In other words, over half of content created is never distributed or seen—representing 100% waste.
Cost Summary Table
| Cost Type | Specific Items | Calculation Method |
|---|---|---|
| Direct Costs | Advertising, production, promotion | Book value |
| Hidden Costs | Labor, planning, management time | Hourly wage × hours |
| Tool Costs | Tool subscriptions | Allocate by usage percentage |
| Distribution Costs | Operations time, channel fees | Estimate or actual expenditure |
GenesysGrowth 2026 data shows B2B small and medium businesses average annual digital marketing budget of $48,200, large enterprises $1.2M+. B2C investment proportion is relatively lower at 5.7% of revenue (compared to B2B’s 8.4%). Knowing these numbers gives you a reference point—is your budget high or low?
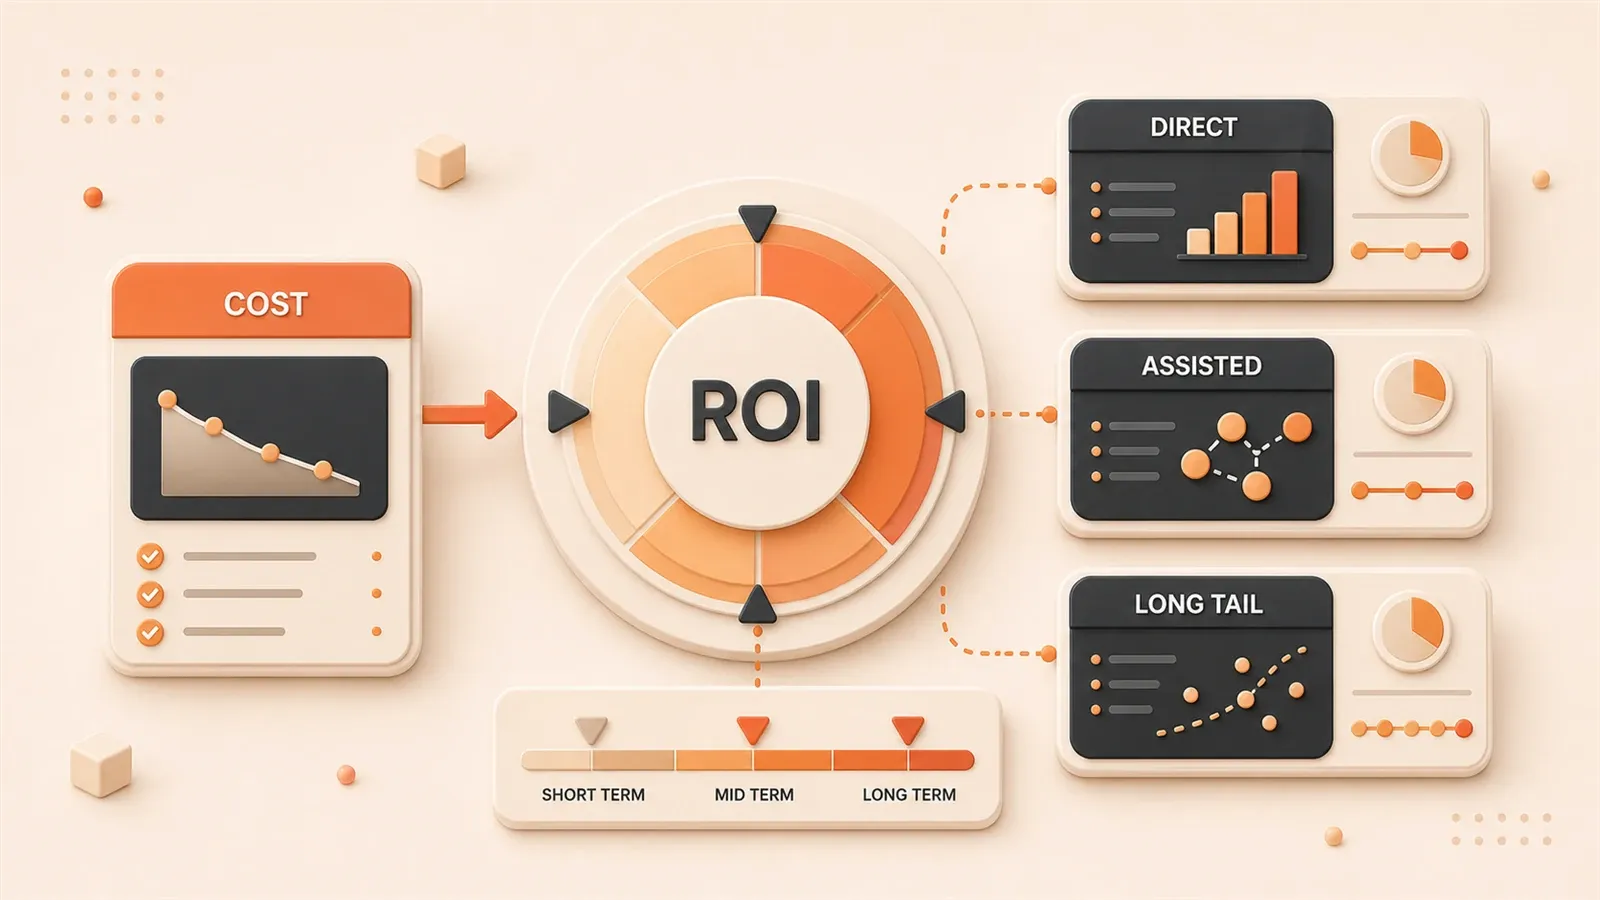
Revenue Quantification—Three-Layer Value Evaluation Framework
Revenue isn’t just transaction amounts. Content marketing value has three layers: direct sales, indirect value, and brand impact. Only counting the first layer gives artificially low ROI; counting all three layers proves true value. This framework is what I’ve summarized from actual projects, helping many friends solve their ROI proof challenges.
Layer One: Direct Sales (Short-Term Quantifiable)
The most intuitive part: transaction amounts directly brought by content.
Tracking methods:
- UTM parameters to mark content source
- Exclusive discount codes linked to content
- Landing page form tracking
For example, a Xiaohongshu post with an exclusive discount code generated 540 orders that month, GMV of 200,000. This is direct sales revenue.
But this layer often represents only a small portion of total value. Xiaohongshu campaign investing 100,000 monthly, with 540 direct orders that month (GMV 200,000), direct ROI = 200 / 100 = 2.0. By many people’s intuition, this is losing money—but wait, read on.
Layer Two: Indirect Value (Medium-Term Estimable)
This includes:
- New leads × average order value × conversion rate
- Retained user increase × customer lifetime value (LTV)
For example: 100 qualified leads, 500 average order value, 20% conversion rate, estimated revenue = 100 × 500 × 20% = 10,000.
Zapier’s case is typical. According to Averi.ai data, Zapier calculated ROI using three-year LTV, resulting in 454%. If only looking at single-month transactions, ROI would be much lower—but SaaS product value lies in long-term subscriptions, so LTV gives a truer picture.
In the Xiaohongshu case, brand searches during the same period jumped from 8,000 to 32,000, new customer ratio rose from 35% to 62%. Search-driven transactions叠加 direct sales, indirect ROI calculated at 4.5—already at industry benchmark level.
Layer Three: Brand Impact (Long-Term Convertible)
This layer is hardest to quantify, but often most valuable.
Includes:
- Brand search increase → search-driven transactions
- Follower growth × active rate × annual spend per customer
A common conversion method: 5 million views × industry CPC of 1 = 5 million in saved advertising costs. The logic: if the same exposure were bought through ads, what would it cost? Content marketing saved that money—that itself is revenue.
In the Xiaohongshu case, that viral post from June was still driving traffic in September, with long-tail ROI calculated at 6.8—over three times the direct ROI.
Three-Layer Value Comparison
| Value Layer | Content | Tracking Method | Xiaohongshu Case |
|---|---|---|---|
| Direct Sales | Current month orders | UTM + discount codes | ROI 2.0 |
| Indirect Value | Leads + new customers | Search index + LTV | ROI 4.5 |
| Long-tail Value | Ongoing traffic | Time series comparison | ROI 6.8 |
At this point, you probably understand why that friend almost had their campaign shut down by the boss. If only looking at current month direct ROI of 2.0, indeed not ideal. But adding indirect and long-tail, true ROI is 6.8—far exceeding the industry benchmark of 4.33:1.
That two hundred thousand wasn’t wasted. The calculation method was just wrong.
Industry Benchmarks—B2B vs B2C ROI Data Comparison Table
After calculating ROI, how do you judge whether it’s good or bad? Comparing to industry benchmarks is the most direct method. B2B and B2C benchmarks differ significantly—using the wrong one misleads decisions.
B2B Industry Benchmarks
B2B content marketing has several characteristics: long decision cycles, high average order values, complex attribution.
Key data (sources: GenesysGrowth, RevenueMemo, FirstPageSage, Data-Mania):
| Metric | Value | Notes |
|---|---|---|
| ROI Median | 4.33:1 | Revenue-to-cost ratio |
| Three-Year Cumulative ROI | 844% | Directive data |
| Blog Conversion Rate Benchmark | 0.8%-1.1% | Target 3x this |
| Email ROI | 261% | ROAS 3.5 |
| Webinars ROI | 213% | Event marketing |
| SEO ROI | 702% | Long-term content strategy |
| Decision Cycle | 270 days | Visionary Marketing |
| Average Touchpoints | 88 | 4 channels, 10 decision makers |
| Annual Budget | $48,200 (SMB) | Large enterprises $1.2M+ |
Interestingly, AI adoption rate is 91%, but 68% can’t prove ROI. The problem isn’t AI itself, but broken attribution chains—B2B buyers experience 88 touchpoints, and traditional “last-click attribution” models can’t trace back to the source.
B2C Industry Benchmarks
B2C is relatively simpler: fast decisions, lower average order values, easier conversion tracking.
Key data:
| Metric | Value | Notes |
|---|---|---|
| Success Rate | 43.3% | Compared to B2B 32% |
| Conversion Rate | 2.8% | Compared to B2B 2.4% |
| Marketing Spend Ratio | 5.7% | As percentage of revenue |
| Short Video ROI Highest | 49% | Marketers agree |
| TikTok Share | 52% | Video content |
| Short Video Revenue Case | $480K | Fitness brand 312 Reels |
B2C’s advantage is faster results—decision cycles are often under 30 days, with visible results in the current month. But ROI benchmarks are slightly lower, due to lower average order values and intense competition.
B2B vs B2C Comparison
| Dimension | B2B | B2C | Difference |
|---|---|---|---|
| Marketing Spend Ratio | 8.4% | 5.7% | B2B invests more |
| Success Rate | 32% | 43.3% | B2C easier to show results |
| Conversion Rate | 2.4% | 2.8% | B2C slightly higher |
| Decision Cycle | 270 days | <30 days | B2B cycle is long |
| ROI Benchmark | 4.33:1 | 3-5:1 | B2B benchmark higher |
| AI Adoption Rate | 91% | - | B2B leading |
Simply put: B2B ROI benchmark is higher, but requires patience for 6-12 months; B2C shows results faster, but benchmark is slightly lower. If your business is B2B, don’t compare against B2C benchmarks—that would underestimate your performance.
Market Size and Trends
RevenueMemo 2026 data shows the digital marketing market growing from $524.73B in 2025 to a projected $989.84B by 2030, compound annual growth rate of 13.53%. 2026 content marketing revenue is approximately $107.5 billion.
CMI and Taboola reports have two more numbers: 91% of marketers achieve content marketing success, and among companies with content strategies, 97% have 61% saying the strategy clearly improved ROI.
These two numbers tell one thing: content marketing does work—the question is how to prove it.
Common Pitfalls—Three Traps and Solutions
When calculating ROI, many fall into three traps: only looking at short-term data, counting all costs into ROI, ignoring indirect value. These three traps distort ROI numbers and can even mislead bosses into cutting effective budgets. I’ve fallen into all of them—let me share how I was wrong, and how I fixed it.
Pitfall One: Only Looking at Monthly Short-Term Data
Xiaohongshu campaign return cycles are longer than TikTok. Calculating monthly, many projects look like they’re losing money.
That skincare brand example: campaign in June, current month ROI 1.6—boss almost stopped it. But by September, that viral post from June continued driving traffic, cumulative ROI 6.8.
Where’s the problem? Content marketing has a lag effect. A post published may still be discovered through search, saved and shared, or recommended by algorithms three months later. Only looking at current month data means you’re only counting the beginning, not the end.
Solution: Track at least quarterly, and set up control groups. For example, compare performance of non-campaign channels during the same period—if other channels didn’t grow traffic but campaign channels did, then the growth came from content.
Pitfall Two: Counting All Costs into ROI
Content marketing serves multiple purposes: brand exposure, mindshare positioning, search presence, user education… counting all costs into it underestimates its contribution.
Xiaohongshu seeding simultaneously improved brand search, new customer ratio, and comment section conversion. These values can’t always be converted to money, but they’re real.
Solution: Separate “sales costs” from “brand costs.” Calculate using different definitions:
- Sales ROI: only count costs related to direct sales
- Brand ROI: count long-term value like brand search growth and new customer ratio improvement
When reporting to the boss, use two numbers for comparison: Sales ROI 2.0 (not ideal), but Brand ROI 4.5 (meeting benchmark). This way of explaining, bosses understand more easily.
Pitfall Three: Ignoring Indirect and Long-Tail Value
Only counting direct sales, ignoring brand search growth, new customer ratio improvement, and long-tail traffic contribution. This is the most common mistake.
Xiaohongshu direct ROI 2.0, but adding indirect ROI 4.5 + long-tail ROI 6.8, true value far exceeds surface numbers.
Solution: Use the three-layer value framework, translating process metrics into outcome metrics.
For example:
- 5 million views × industry CPC of 1 = 5 million in saved ad spend
- 100,000 followers × 20% active rate × 200 annual spend per customer = 4 million in potential revenue
When reporting this way, the boss sees not “how many articles published,” but “how much ad spend saved, how much potential revenue generated.”
New Challenge in the AI Era: Broken Attribution Chains
Visionary Marketing’s 2026 report mentions a dilemma: B2B buyers experience 88 touchpoints, 4 channels, 10 decision makers. Traditional “last-click attribution” fails—the last click might be paid search, but what drove the decision was a blog post read three months ago.
AI adoption rate is 91%, but 68% can’t prove ROI. AI investment average return is 3.7x, but attribution is fuzzy—can’t identify which link played the key role.
Solution: Use multi-touch attribution models, deploy CDP (Customer Data Platform) to integrate full-journey behavioral data. Tools like HubSpot, Marketo, and Sensors Data can do this. Of course, this requires certain technical investment—for small teams, using the three-layer value framework for estimation might be enough.
Optimization Strategies—Five Paths from Benchmark to Improvement
After calculating ROI clearly, next step is improvement. From industry benchmarks to practical cases, here are five actionable optimization paths.
Strategy One: Focus on High-ROI Content Formats
GenesysGrowth 2026 data shows 49% of marketers believe short video has the highest ROI, surpassing traditional text and images. Facebook approval rate is also 54%.
Short video’s advantages are fast distribution, high engagement, and platform algorithm support. Fitness brand case: through 312 Reels obtained $480K in revenue—single video average contribution of $1,538.
Action Items:
- Increase short video content proportion, test Reels/Shorts/TikTok
- Adapt existing text/image content into short videos
- Monitor platform algorithm changes, adjust formats timely
Strategy Two: Extend Content Lifecycle
Sirius Decisions data: 60%-70% of content goes unused. Meaning production costs are completely wasted.
Short content lifecycle means naturally low ROI. The way to extend lifecycle is repurposing: one piece of content distributed across multiple channels.
Content Repurposing Path:
Blog post → Social media summary → Email newsletter push → Short video adaptation → Ebook compilation
A friend’s approach: write one in-depth blog monthly, then split into 5 social media posts, 1 video, 1 email. Originally only reaching blog readers, now reaching 3x the audience. Content production cost unchanged, but revenue tripled.
Strategy Three: Optimize Conversion Funnel
B2B blog conversion rate benchmark is 0.8%-1.1%, target should be 3x that—meaning 2.4%-3.3%.
Low conversion rate limits ROI regardless of how high. Methods to optimize conversion funnel:
- Landing page optimization: clear CTA, reduce bounce
- Add interactive elements: ROI calculators, assessment tools, quiz tests
- A/B testing: compare conversion performance of different versions
Data-Mania data: companies using interactive tools grow 80% faster. Readers don’t just “view” but “participate”—engagement increases conversion willingness.
Strategy Four: Use Multi-Touch Attribution
Single-touch attribution models underestimate content value. Last-click attribution gives credit to paid search, but what drove the decision might be a blog from three months ago.
Action Items:
- Deploy CDP to integrate full-journey behavioral data
- Use multi-touch attribution models (linear attribution, time-decay attribution)
- Tools: HubSpot, Marketo, Sensors Data, FineReport BI
Of course, this costs more for small teams. With limited budget, Email marketing ROI of 261% can be a starting point—email tracking is relatively simple, attribution is clear.
Strategy Five: Report ROI to Leadership
This last one is most practical: translate process metrics into outcome metrics.
Bosses don’t care about “how many articles published,” they care about “how much spent, how much earned.”
Translation Formula:
| Process Metric | Outcome Metric Translation |
|---|---|
| 5 million views | 5 million in saved ad spend (calculated at 1 CPC) |
| 100,000 followers | 4 million in potential revenue (20% active rate × 200 annual spend per customer) |
| Brand search +300% | Search-driven transaction share rose from 15% to 35% |
| New customer ratio +27% | New customer contributed revenue rose from 350K to 620K |
Next time reporting, don’t just say “published 200 articles, 5 million views.” Try saying:
“Content marketing saved 5 million in ad spend, brought 4 million in potential revenue, achieved 4.5x ROI—that’s at the industry standard level of 4.33:1.”
When the boss understands, the budget is secure.
Conclusion
After all this, the core comes down to three things:
First, formula must be consistent. Basic formula, simplified formula, revenue-to-cost ratio—which one you choose doesn’t matter, the key is telling the boss which calculation you’re using. Don’t compare with industry benchmarks using inconsistent definitions—that will mislead decisions.
Second, costs must be complete, revenue must be viewed in three layers. Direct costs are just the tip of the iceberg, hidden costs are often the bulk. Don’t only look at direct sales—indirect value and long-tail value combined are the true ROI. The Xiaohongshu case going from 2.0 to 6.8, the difference is in this part.
Third, benchmarks must distinguish B2B from B2C. B2B ROI benchmark 4.33:1, cycle 270 days; B2C benchmark 3-5:1, cycle under 30 days. Using the wrong benchmark will overestimate or underestimate your performance.
Avoid three pitfalls: don’t only look at monthly short-term data, don’t count all costs into ROI, don’t ignore indirect and long-tail value. Add five optimization paths: focus on short video, extend content lifecycle, optimize conversion funnel, multi-touch attribution, learn to report to leadership.
Next time reporting, don’t just say “published 200 articles, 5 million views.” Try: “Content marketing saved 5 million in ad spend, brought 4 million in potential revenue, achieved 4.5x ROI—that’s at the industry standard 4.33:1 level.” When the boss understands, the budget is secure.
Content Marketing ROI Frequently Asked Questions
How do you calculate content marketing ROI?
What’s the difference between B2B and B2C ROI benchmarks?
Why shouldn’t you only look at monthly ROI?
How do you account for hidden costs in ROI?
How do you prove content marketing value to leadership?
FAQ
How do you calculate content marketing ROI?
What's the difference between B2B and B2C ROI benchmarks?
Why shouldn't you only look at monthly ROI?
How do you account for hidden costs in ROI?
How do you prove content marketing value to leadership?
16 min read · Published on: May 16, 2026 · Modified on: Jul 14, 2026
Content Marketing Complete Guide
If you landed here from search, the fastest way to build context is to jump to the previous or next post in this same series.
Previous
Content Marketing ROI Calculation: A Quantitative Guide from Formula to Benchmarks
Master content marketing ROI calculation formulas, understand industry benchmarks like 844% for B2B and 702% for SEO, learn cost breakdown and revenue quantification, plus 5 strategies to improve your ROI.
Part 19 of 26
Next
Content Monetization Guide: Multiple Paths from Traffic to Revenue
Have traffic but don't know how to make money? This article details 6 monetization paths and funnel architecture for 2026, from subscriptions and digital products to brand partnerships. Find the monetization strategy that fits you best.
Part 21 of 26


Comments
Sign in with GitHub to leave a comment